eSIM sales analytics, read from your own orders.
Revenue, orders, new customers, best-selling packages and every sales channel side by side, in your dashboard. Every figure is read from your real orders, and a figure that cannot be computed honestly is not shown at all.
- Compared with the previous period
- In your own time zone
- CSV export
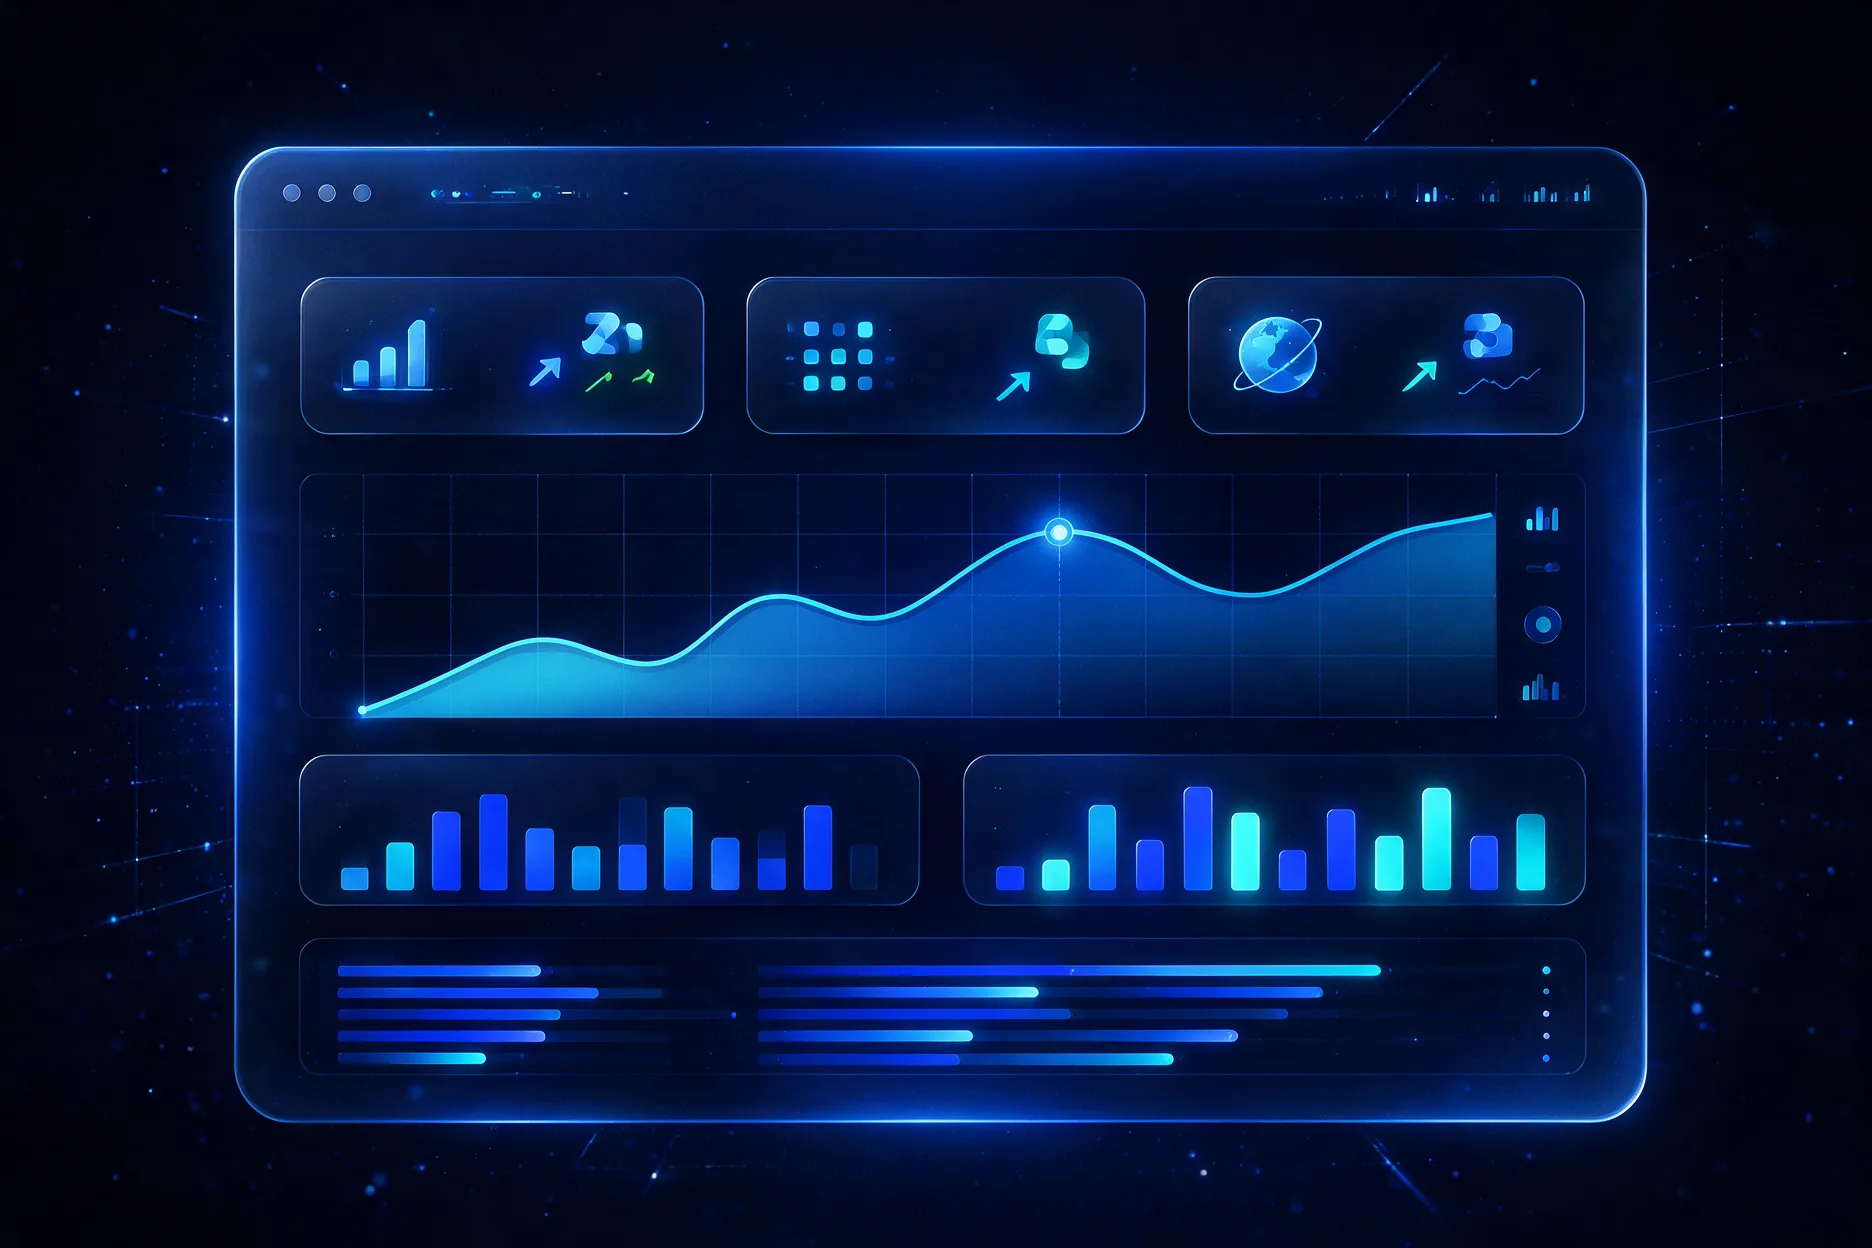
The overview
What does the eSIMLab dashboard show?
The overview shows what your eSIM business took in a period and how that compares with the identical period before it: revenue, paid orders, new customers, a revenue chart, takings per sales channel and your best-selling packages. Pick today, 7 days, 30 days, 12 months or your own dates.
Revenue
Paid sales in the period, one line per currency you settle in. Two currencies are never added into one meaningless total.
Orders
The number of paid orders, with the change against the previous period beside it.
New customers
People whose first paid order landed in the period. An abandoned checkout does not count as a customer.
Revenue chart
Day by day for shorter periods, month by month for a year. A day without sales shows as zero, not as a gap.
By channel
Every sales channel with its own takings in its own currency, including a channel that sold nothing this period.
Best-selling packages
Your top eight packages, ranked by revenue, or by units sold when you settle in more than one currency.
Beyond the overview
The screens behind the numbers
When a figure raises a question, the answer is one screen away. Each of these reads the same orders the overview does, so two screens cannot disagree about the same sale.
- Orders: payment status, whether the eSIM was delivered, and how a counter sale was settled
- Customers: everyone who bought, with what they spent, exportable as CSV
- Payments: money in, with the Stripe reference for every card payment
- Agency counter: today's sales at the till and the paid sales each desk has taken
- Guest page: how often each printed QR code was scanned, how many scans bought, and what it earned
Put it to work
Use it to make three decisions
Reporting is only useful if it changes what you do next. These are the questions the overview is built to answer.
What to promote
Push the packages your travellers already buy, from the best-selling list, instead of guessing at a campaign.
Which channel earns
See whether the counter, the guest page or the online store is actually selling, without adding up separate dashboards by hand.
What to fix
A paid order whose eSIM has not been delivered is shown as such, and you can try issuing it again from the order.
Storefront tracking
Can you use Google Analytics on your eSIM store?
Yes. Add your own measurement IDs in the workspace and they run on your storefront, but only after a visitor accepts cookies in the consent banner. Visitor traffic and conversion are measured there, in your own analytics tool, rather than in the eSIMLab dashboard.
| Tool | What you enter |
|---|---|
| Google Analytics 4 | Your measurement ID |
| Google Tag Manager | Your container ID |
| Google Search Console | Your verification token |
| Plausible | Your site domain |
| Google Ads | Your conversion ID and label |
| Meta Pixel and TikTok Pixel | Your pixel ID |
Stated plainly
What the dashboard does not show yet
A blank is honest; a plausible number is not. Two figures are left out until the data behind them exists.
Conversion rate
The dashboard does not count storefront visitors or checkout starts, so it has nothing to divide by. Use your own analytics tool for traffic and conversion.
Profit margin per order
Orders do not yet record what the package cost you, so the dashboard shows revenue rather than margin. Your provider's own account shows what you paid.
FAQ
Analytics questions
Something else on your mind? Write to us on the contact form.
Can I export the data?
Yes. The Orders and Customers screens each have an Export CSV button, so you can hand the figures to your accountant or load them into your own spreadsheet or BI tool.
Is the data live?
The overview is read from your orders each time you open it, so a sale counts as soon as it is paid. Traffic figures in your own analytics tool follow that tool's processing delay.
Which time zone are the figures in?
Yours. Once you set your time zone in the workspace, today, every day boundary and the comparison periods follow your own clock, so the dashboard's takings match your till. A shop that has not set one uses UTC.
Can staff see revenue?
Only the Owner and Admin roles see revenue and the overview's takings. Marketing, Sales and Support users can work with orders and customers without seeing the shop's money as a whole.
Does the dashboard show my profit margin?
Not yet. Orders do not record what each package cost you, so the dashboard shows revenue rather than margin instead of estimating a figure it cannot prove.
Can I see sales per counter or per channel?
Yes. The overview lists every sales channel with its own takings, the agency counter shows each desk's paid sales, and the guest page shows scans, sales and earnings for each printed QR code.
Your eSIM brand, live on your own domain.
Create an account, connect a provider and Stripe, and start selling under your own name.